Telemetry
Telemetry is a first-class runtime surface. Read it from the Analyze perspective or from the HTTP API. Do not tail a log or poll a screenshot for a number that the port registry already publishes.
Telemetry answers three different questions, and they should not be confused:
| Question | Read |
|---|---|
| What is exposed at the wiring boundary? | ReadPorts or the Telemetry panel |
| What does the Modelica solver currently hold? | SnapshotVariables |
Is the end-to-end Modelica → physics chain healthy? |
CosimStatus |
In the window
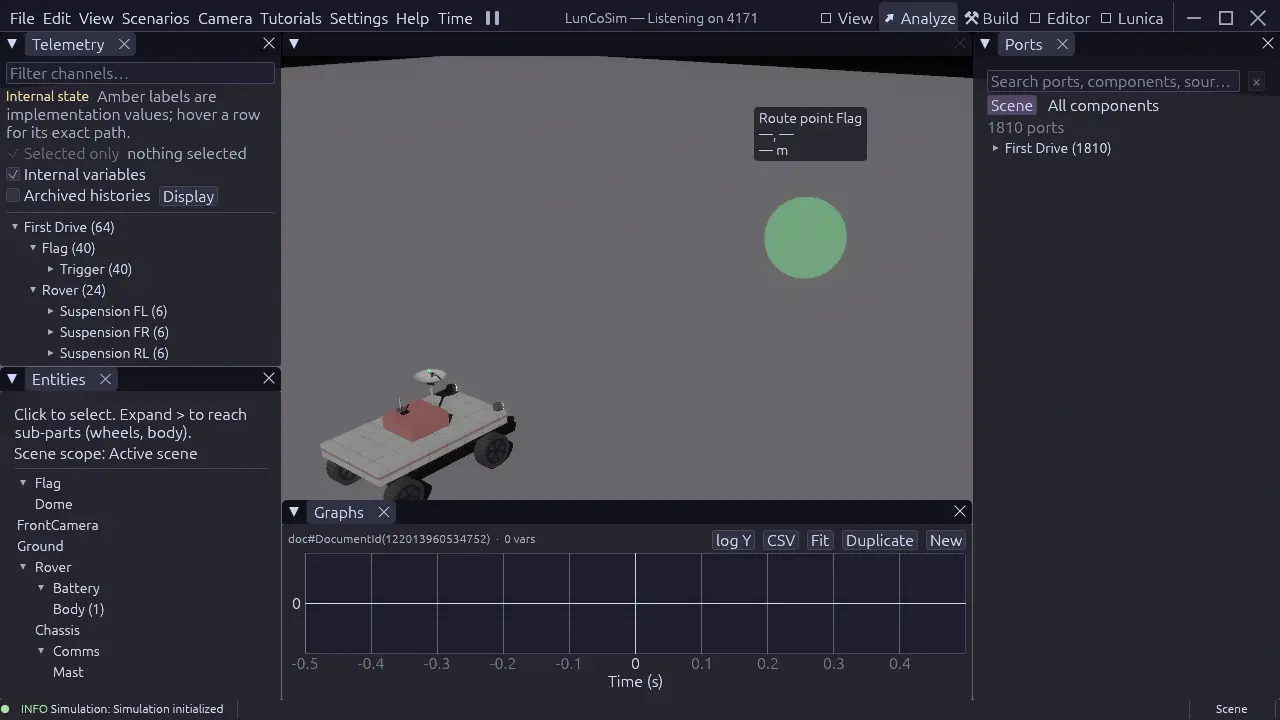
- Switch to Analyze.
- Open Telemetry. It lists the live port-bearing entities and their channels.
- Select an entity to see its current values. An absent port is not a zero; the entity may still be preparing.
- Open Graphs and add a channel to see it over time. This is the right tool for settling, oscillation, and arrival checks.
- Use Ports to inspect the resolved direction and kind of each port before wiring a target.
The graph records real simulation samples. It is not a render-frame animation. When the world is paused, the last sample stays visible. Pausing does not rewind, interpolate, or replay rendered frames.
A port's direction is part of its contract. Write inputs; read outputs. A value that appears in the inspector is not necessarily a value that another model may write. If a wiring target rejects a connection, inspect the resolved direction and kind first.
From the HTTP API
Start LunCoSim with an explicit port:
Find an entity:
PORT=4101

curl -s "http://127.0.0.1:$PORT/api/commands" \
  -H "Content-Type: application/json" \
  -d '{"type": "ListEntities"}'
The response contains each entity's api_id. Use that identity for reads:
# Discover the port names first; ReadPorts requires explicit names.
curl -s "http://127.0.0.1:$PORT/api/commands" \
  -H "Content-Type: application/json" \
  -d '{"type": "ExecuteCommand", "command": "ListPorts",
       "params": {"api_id": 42}}'

curl -s "http://127.0.0.1:$PORT/api/commands" \
  -H "Content-Type: application/json" \
  -d '{"type": "ExecuteCommand", "command": "ReadPorts",
       "params": {"api_id": 42,
                  "port_names": ["throttle", "steer", "speed"]}}'
ReadPorts returns the selected rows for one entity. It does not dump every
port; name what you need. Use ReadPortsBatch when you need one shared
sim_tick across several entities.
The request envelope, discovery endpoint, and error shape are documented in HTTP API.
Modelica state
A rendered port is not necessarily the whole solver state. To inspect the Modelica side:
curl -s "http://127.0.0.1:$PORT/api/commands" \
  -H "Content-Type: application/json" \
  -d '{"type": "ExecuteCommand", "command": "SnapshotVariables",
       "params": {"api_id": 42}}'
SnapshotVariables answers "what does the model currently hold?" Use
ReadPorts for "what is exposed at the wiring boundary?" and CosimStatus for
the end-to-end Modelica → physics chain.
Readiness matters
Before treating a value as final, check readiness:
Require:
ready: trueworld_hold: falsepending_count: 0
A port may be momentarily absent while its model is compiling or its scene is still being admitted. That is different from a valid zero. A required-data hold keeps the world held even when the window is responsive; dismissing the preparation window does not release that hold.
Screenshots
Numbers answer "what value?" A screenshot answers "does the scene look right?" Capture the visible production window, not a headless substitute:
curl -s "http://127.0.0.1:$PORT/api/commands" \
  -H "Content-Type: application/json" \
  -d '{"type": "ExecuteCommand", "command": "CaptureScreenshot",
       "params": {"save_to_file": true, "path": "target/telemetry-check.png"}}'
The path is relative to the process working directory. Read the resulting PNG before reporting a visual result.
Recording evidence
A useful telemetry check has three parts:
- Readiness. Record
ready,world_hold, andpending_countat the time of the read. - Identity. Record the entity
api_id, the exact port names, and thesim_tickor batch tick that produced the values. - Trend. Use a graph or a series of reads for settling, oscillation, or arrival. A single sample is not a trend.
For an operator lifecycle, see Mission control. For turning a live value into a repeatable check, see Validation.
Common traps
| Trap | Better read |
|---|---|
| Polling stdout for a value | ReadPorts or the Telemetry panel |
Treating a missing port as 0.0 |
Check readiness and ListPorts |
| Using a single sample for a trend | Record a graph or a time series |
| Reading a render FPS as simulation cadence | Inspect the clock and timing profile |
| Comparing values from different ticks | Use one ReadPorts or ReadPortsBatch response |
| Looking only at ports for solver state | Also call SnapshotVariables |
| Treating a dismissed preparation window as released hold | Check world_hold and the required-data state |
| Using a headless screenshot as visual evidence | Capture the visible production window |
Continue with HTTP API for the request envelope, or Analyze for the perspective that arranges Telemetry, Ports, and Graphs.